In this piece we focus on the breakdown of road motorcycle sales across individual sub-categories such as Sports, LAMs, Adventure-Touring and so on.
Motorcycle Sales Data
Road Motorcycle Sales Figures
Australia – First Half 2018
While down 5.3 per cent road motorcycles remain the biggest component of the Australian market.
Motorcycle Brand Results
Honda continues to lead the overall Australian motorcycle market despite a 7.6 per cent decline in sales compared to the first half of 2017.
Yamaha improved their numbers by 2.6 per cent to close the gap to Honda but are still more than 1500 units shy of Big Red’s total volume. Honda have 24.3 per cent of the overall market to Yamaha’s 21 per cent.
Kawasaki are also travelling quite well, 3.3 per cent up last year to stay well ahead of fourth placed Suzuki on combined sales across all sectors of the market. Kawasaki’s market share at 9.8 per cent while Suzuki holds 7.8 per cent of the market. These numbers include road, off-road, scooter and ATV sales.
Harley-Davidson is down 18.1 per cent to slip to fifth strongest brand overall.
KTM shed 5.9 per cent while ATV specialist Polaris is down 11.1 per cent.
BMW, BRP and Triumph are all pretty much equalling their 2017 sales figures for this halfway stage of the year.
Husqvarna had enjoyed a stellar first half of 2017 but that trend has not continued quite as impressively in 2018. Husky are down 12.5 per cent overall despite picking up more road volume.
Ducati are down 15.4 per cent however their sportsbike sales are still quite reasonable thus the decline is amongst other parts of their range.
Indian continues to progress from what been a low base to now start to sell in good numbers. 453 Indians found new homes so far in 2018 which is a good result in this market.
Aprilia and Moto Guzzi are starting to claw their way back up after a dramatic lull last year brought on by the change over period between distributors.
Road Bikes Top Ten Overall
Australia – First Half 2018
| Top 10 by Category – Road Bikes | ||||
| January – June 2018 compared to January – June 2017 | ||||
| Manufacturer | Model | Total | ||
| YTD 2018 | YTD 2017 | % CHAN | ||
| Honda | CB125E | 637 | 330 | 93.0% |
| Honda | NBC110 | 582 | 1042 | -44.1% |
| Yamaha | MT07L | 504 | 470 | 7.2% |
| Harley Davidson | XG500 | 466 | 609 | -23.5% |
| Yamaha | YZF-R3A | 445 | 569 | -21.8% |
| Kawasaki | NINJA 400 | 443 | 0 | 100% |
| Yamaha | MT-09 | 384 | 418 | -8.1% |
| Harley Davidson | FXBRS | 384 | 0 | 100% |
| Kawasaki | Vulcan S | 378 | 274 | 38.0% |
| Yamaha | MT03LA | 376 | 239 | 57.3% |
Supersport Motorcycle Sales Data
Australia – First Half 2018
While bikes such as the Ninja 400, CBR500R and CBR300R are put in this category by the manufacturer body, the FCAI, I don’t think these models are what we would generally represent as sportsbikes, thus we can realistically say that BMW’s S 1000 RR is currently Australia’s #1 selling ‘proper’ sportsbike.

| Top 10 by Category – Super Sport | ||||
| January – June 2018 compared to January – June 2017 | ||||
| Manufacturer | Model | Total | ||
| YTD 2018 | YTD 2017 | % CHAN | ||
| Kawasaki | NINJA 400 | 443 | 0 | 100% |
| Honda | CBR500R | 310 | 471 | -34.2% |
| Honda | CBR300R | 264 | 201 | 31.3% |
| BMW | S 1000 RR | 108 | 115 | -6.1% |
| Ducati | Panigale V4 | 102 | 0 | 100% |
| Suzuki | GSX-R750 | 80 | 40 | 100.0% |
| Yamaha | YZF-R1 | 73 | 76 | -3.9% |
| Ducati | 959 Panigale | 67 | 123 | -45.5% |
| Honda | CBR1000RR | 65 | 143 | -54.5% |
| Suzuki | GSX-R1000 | 62 | 128 | -51.6% |
Sport-Touring Motorcycle Sales Data
Australia – First Half 2018
Again, the YZF-R3A and Ninja 300 are not what we would classify as sports-touring machines, but this is the data…
| Top 10 by Category – Sport Touring | ||||
| January – June 2018 compared to January – June 2017 | ||||
| Manufacturer | Model | Total | ||
| YTD 2018 | YTD 2017 | % CHAN | ||
| Yamaha | YZF-R3A | 445 | 569 | -21.8% |
| Kawasaki | Ninja 300 | 268 | 448 | -40.2% |
| Honda | CBR650FL | 181 | 139 | 30.2% |
| Kawasaki | Ninja 650L | 161 | 250 | -35.6% |
| KTM | RC390 | 125 | 153 | -18.3% |
| Suzuki | GSX250R | 87 | 34 | 155.9% |
| Suzuki | GSX-S125 | 76 | 0 | 100% |
| Kawasaki | Ninja 1000 | 75 | 95 | -21.1% |
| Kawasaki | VERSYS-X 300 | 73 | 46 | 58.7% |
| BMW | S 1000 XR | 69 | 62 | 11.3% |
Touring Motorcycle Sales Data
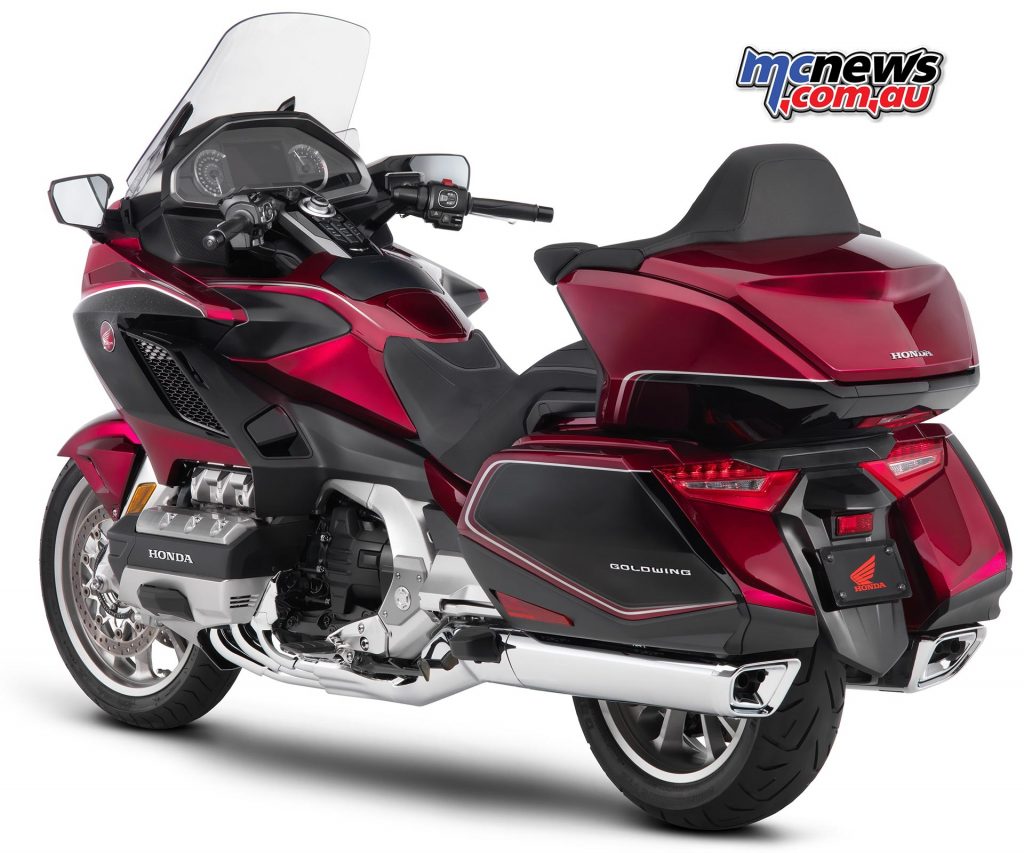
Harley’s big touring models are still largely doing okay while the BMW R 1200 RT is tiggling along nicely while Honda’s new Gold Wing found 80 new homes.
Australia – First Half 2018
| Top 10 by Category – Touring | ||||
| January – June 2018 compared to January – June 2017 | ||||
| Manufacturer | Model | Total | ||
| YTD 2018 | YTD 2017 | % CHAN | ||
| Harley Davidson | FLHXS | 122 | 197 | -38.1% |
| BMW | R 1200 RT | 82 | 69 | 18.8% |
| Honda | GL1800 | 80 | 28 | 185.7% |
| Harley Davidson | FLHRXS | 70 | 48 | 45.8% |
| Harley Davidson | FLHTK | 69 | 124 | -44.4% |
| Harley Davidson | FLHTCUTG | 65 | 0 | 100% |
| Harley Davidson | FLHX | 60 | 0 | 100% |
| Yamaha | FJR1300 | 50 | 39 | 28.2% |
| Indian Motorcycle | Roadmaster | 49 | 47 | 4.3% |
| Harley Davidson | FLTRXS | 46 | 60 | -23.3% |
Adventure-Touring Motorcycle Sales Data
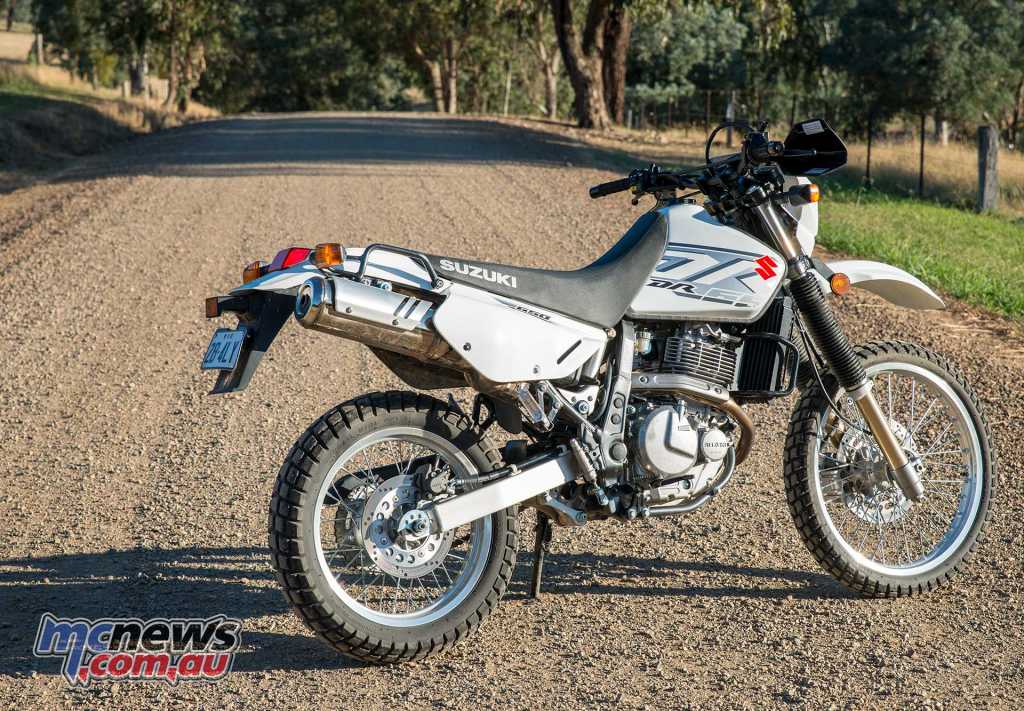
Honda’s Africa Twin still tops the adventure-touring charts ahead of Suzuki’s DR650 stalwart while BMW’s big GS twins are rocking along nicely.
Australia – First Half 2018
| Top 10 by Category – Adventure Touring | ||||
| January – June 2018 compared to January – June 2017 | ||||
| Manufacturer | Model | Total | ||
| YTD 2018 | YTD 2017 | % CHAN | ||
| Honda | CRF1000 | 318 | 404 | -21.3% |
| Suzuki | DR650SE | 274 | 236 | 16.1% |
| BMW | R 1200 GS Adventure | 221 | 172 | 28.5% |
| BMW | R 1200 GS | 169 | 203 | -16.7% |
| Kawasaki | KLR650 | 137 | 179 | -23.5% |
| BMW | G 310 GS | 112 | 0 | 100% |
| Honda | CB500XA | 111 | 154 | -27.9% |
| Triumph | Tiger 800 XC | 111 | 71 | 56.3% |
| Suzuki | DL650 | 109 | 83 | 31.3% |
| Triumph | Tiger Explorer | 93 | 46 | 102.2% |
LAMs Motorcycle Sales Data
Australia – First Half 2018
The top ten for the Learner Approved Motorcycles Category is a bit of a strange one as it also includes a few off-road bikes, while here we were trying to talk road bikes only, but we only can work with the data we have…
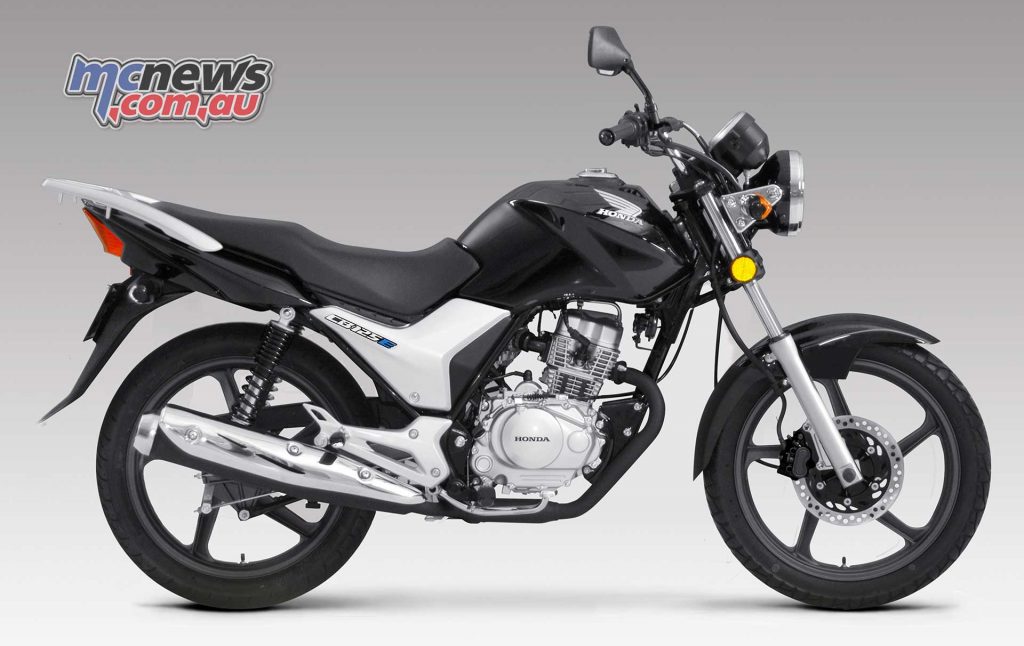
However, it can be somewhat of an interesting comparison between the numbers recorded by the most popular road and off-road motorcycles that are eligible for full road registration.
| Top 10 by Category – LAMS Approved | ||||
| January – June 2018 compared to January – June 2017 | ||||
| Manufacturer | Model | Total | ||
| YTD 2018 | YTD 2017 | % CHAN | ||
| Honda | CB125E | 637 | 330 | 93.0% |
| Yamaha | WR450F | 620 | 762 | -18.6% |
| Honda | NBC110 | 582 | 1042 | -44.1% |
| KTM | 300EXC | 519 | 347 | 49.6% |
| Yamaha | MT07L | 504 | 470 | 7.2% |
| Harley Davidson | XG500 | 466 | 609 | -23.5% |
| Yamaha | YZF-R3A | 445 | 569 | -21.8% |
| Kawasaki | NINJA 400 | 443 | 0 | 100% |
| Honda | CRF250L | 440 | 433 | 1.6% |
| Suzuki | DR-Z400E | 435 | 442 | -1.6% |
Cruiser Motorcycle Sales Data
Australia – First Half 2018
Harley predictably rule the cruiser roost but Kawasaki’s Vulcan S is selling extremely well as is Honda’s CMX500. Indian Scout sales are also up considerably.
| Top 10 by Category – Cruiser | ||||
| January – June 2018 compared to January – June 2017 | ||||
| Manufacturer | Model | Total | ||
| YTD 2018 | YTD 2017 | % CHAN | ||
| Harley Davidson | XG500 | 466 | 609 | -23.5% |
| Harley Davidson | FXBRS | 384 | 0 | 100% |
| Kawasaki | Vulcan S | 378 | 274 | 38.0% |
| Honda | CMX500 | 350 | 216 | 62.0% |
| Indian Motorcycle | Scout | 258 | 153 | 68.6% |
| Harley Davidson | FXBB | 240 | 0 | 100% |
| Yamaha | XVS650/A | 226 | 254 | -11.0% |
| Harley Davidson | FLFBS | 222 | 0 | 100% |
| Harley Davidson | FLSB | 168 | 0 | 100% |
| Harley Davidson | XL883N | 143 | 132 | 8.3% |
Naked Motorcycle Sales Data
Australia – First Half 2018
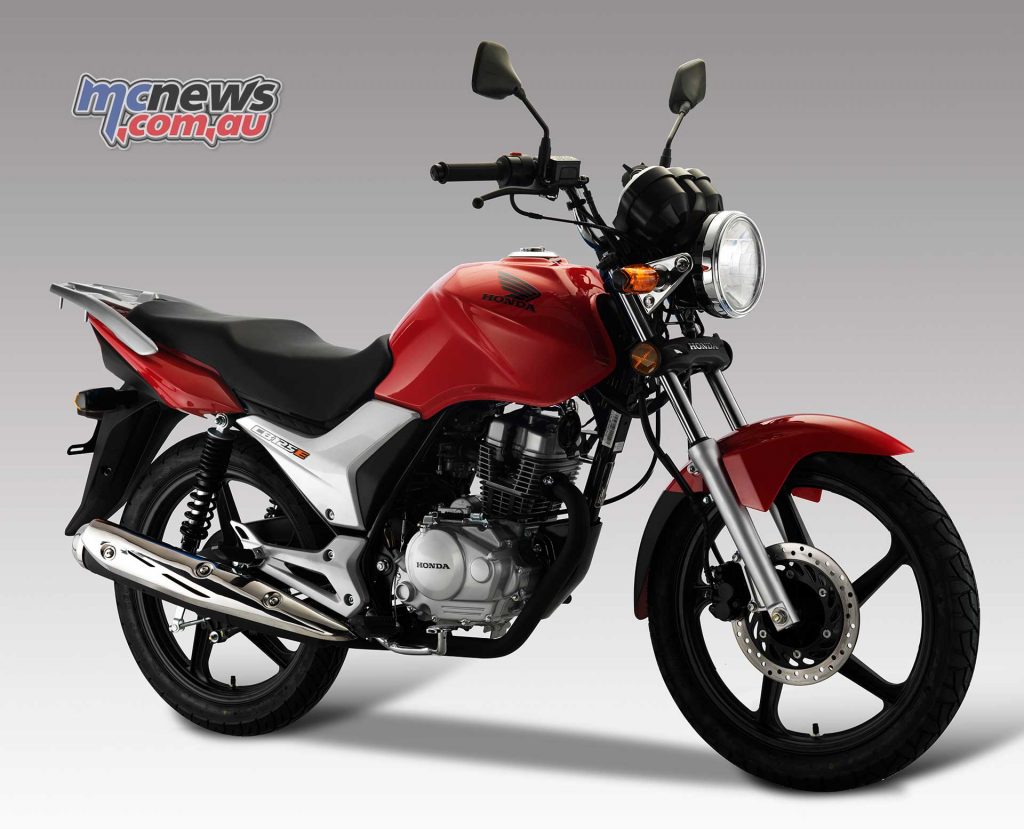
The traditional naked favourites are headed by the bargain priced Honda CB125E. Kawasaki’s Z900RS has made a strong debut with 246 sales.
| Top 10 by Category – Naked | ||||
| January – June 2018 compared to January – June 2017 | ||||
| Manufacturer | Model | Total | ||
| YTD 2018 | YTD 2017 | % CHAN | ||
| Honda | CB125E | 637 | 330 | 93.0% |
| Yamaha | MT07L | 504 | 470 | 7.2% |
| Yamaha | MT-09 | 384 | 418 | -8.1% |
| Yamaha | MT03LA | 376 | 239 | 57.3% |
| Honda | GROM | 355 | 597 | -40.5% |
| Kawasaki | Z900RS | 246 | 0 | 100% |
| Honda | CB300F | 200 | 104 | 92.3% |
| KTM | 390DUKE | 156 | 174 | -10.3% |
| Yamaha | XSR700LA | 152 | 86 | 76.7% |
| Triumph | STR TRIPLE R | 133 | 91 | 46.2% |
Scooter Motorcycle Sales Data
Australia – First Half 2018
| Top 10 by Category – Scooters | ||||
| January – June 2018 compared to January – June 2017 | ||||
| Manufacturer | Model | Total | ||
| YTD 2018 | YTD 2017 | % CHAN | ||
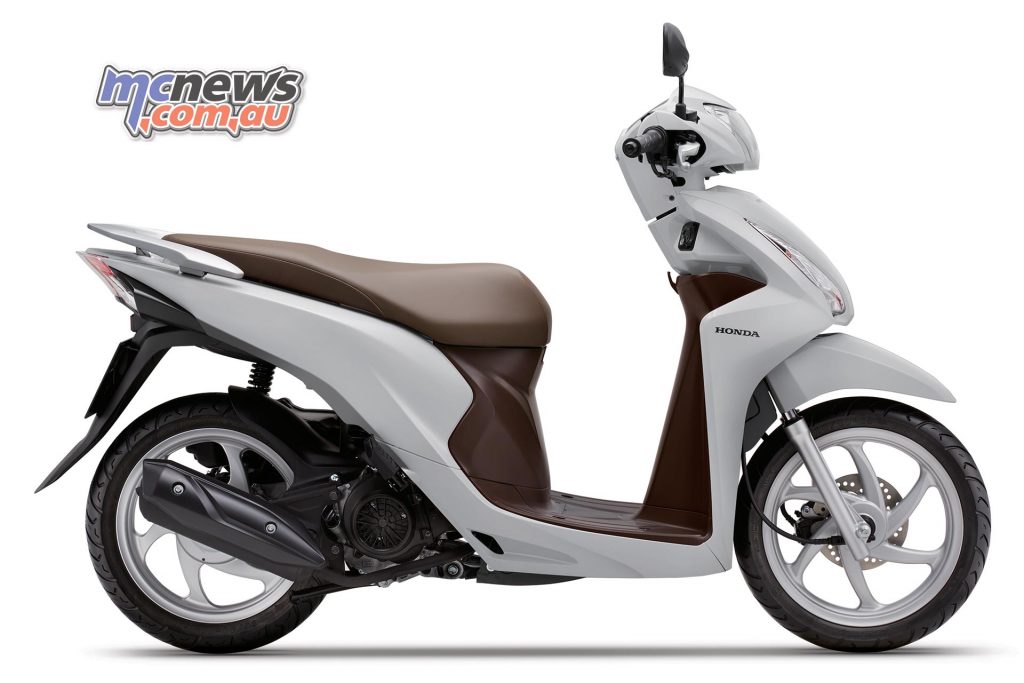
| Honda | NSC110 | 238 | 111 | 114.4% |
| Suzuki | ADDRESS | 203 | 174 | 16.7% |
| Vespa | GTS 300 | 196 | 102 | 92.2% |
| Piaggio | Fly 150 | 184 | 150 | 22.7% |
| Honda | WW150 | 135 | 132 | 2.3% |
| Piaggio | ZIP 50 | 128 | 149 | -14.1% |
| Vespa | PRIMAVERA 150 | 103 | 96 | 7.3% |
| Honda | MW110 | 89 | 90 | -1.1% |
| Piaggio | Typhoon 50 | 84 | 82 | 2.4% |
| Yamaha | XMAX300 | 68 | 0 | 100% |


